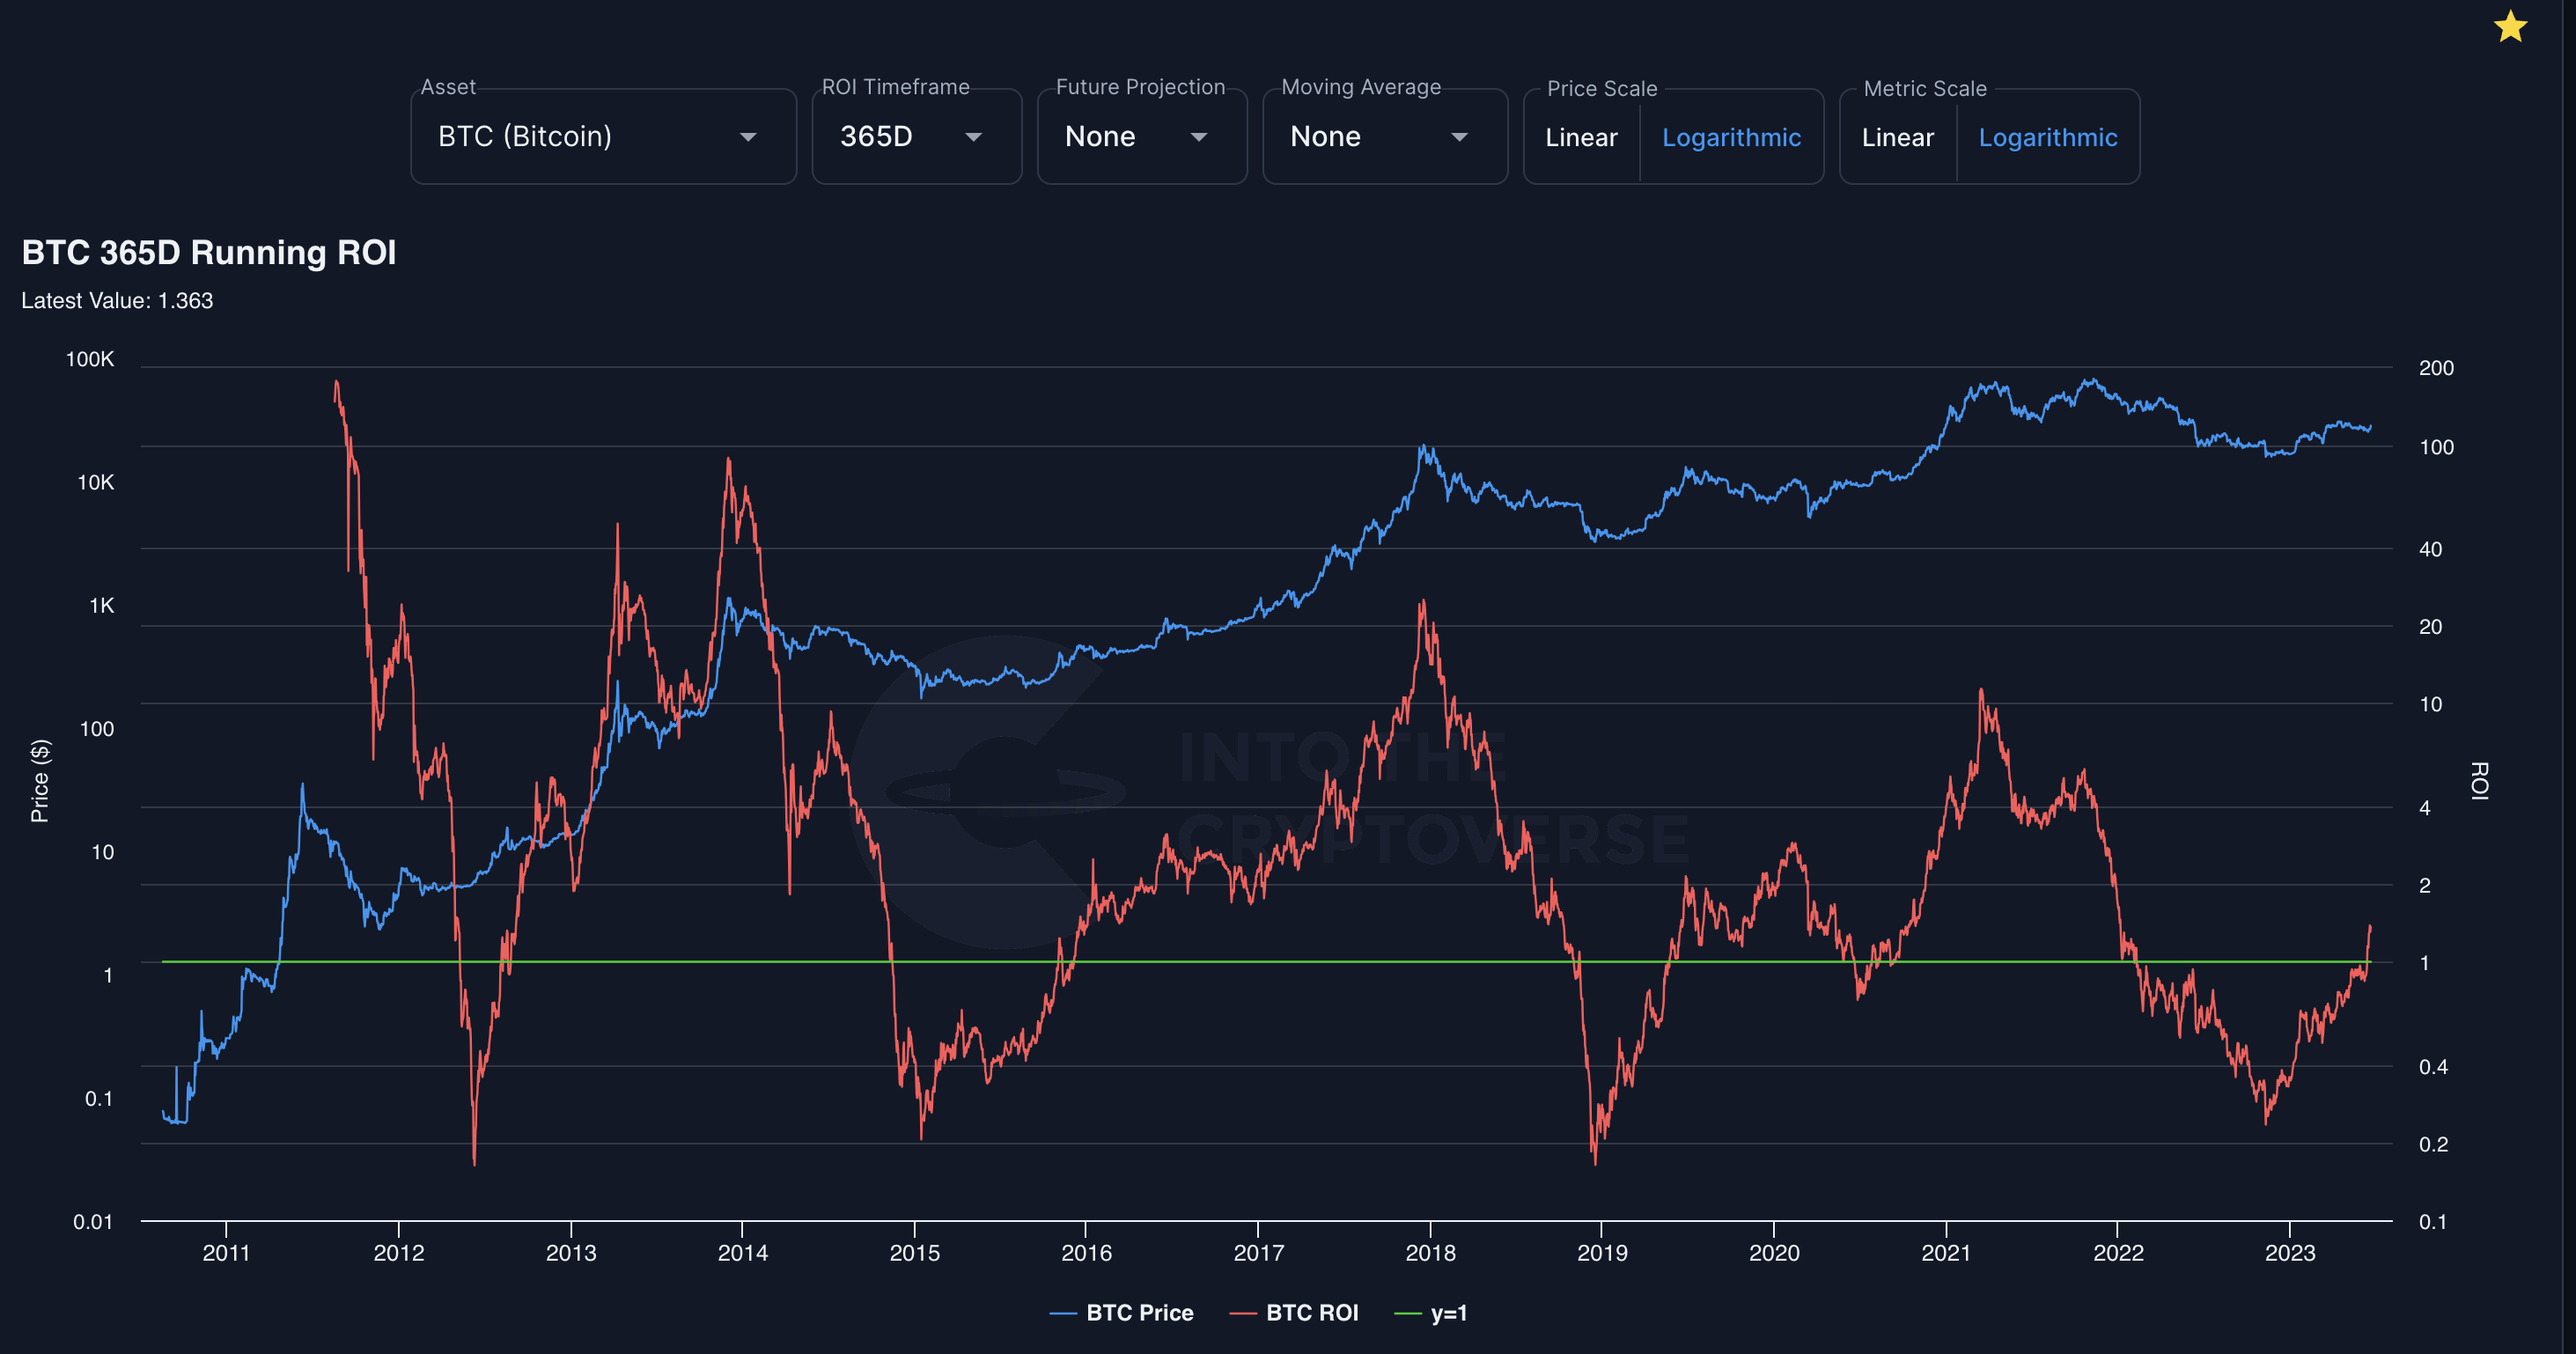
2023-06-21 BTC Running ROI : 1.36
Description
This chart shows the running return on investments (ROI) for various cryptocurrencies. The running return on investment is defined as the profit multiple you would have had at any date if you would have bought a certain period prior to that date. The calculation therefore is to divide the current price at any point by the price X days ago. For example, the Bitcoin 1 year ROI chart gives a value of 1.83 at June 27th, 2019. This means that if you would have bought at June 27th 2018 and waited for 1 year then your return on investment would be a 1.83x or an 83% gain.
The n year ROI looks back n * 365 days for simplicity. This implies that the 2 year ROI will start at August 15th 2012 whereas the data starts on August 16th 2010. That is because 2012 is a leapyear and contains 366 days.
Usage
For every Bitcoin on every timeframe there is a downwards trend in the peaks of the running ROI. Therefore this chart is displaying diminishing returns; as time goes on and the market capitalization increases and your expected returns diminish after holding a certain period of time. Back in March of 2021 this chart helped us identify and explain where the Bitcoin pullback was going to happen since it respected the trendline drawn through the previous peaks.
출처: intothecryptoverse
'Onchain Data' 카테고리의 다른 글
| 2022-06-22 Short Term Bubble Risk - bitcoin (0) | 2023.06.22 |
|---|---|
| 2023-06-22 Altcoin Season Index (0) | 2023.06.22 |
| 2023-06-21 Youtube Views - bitcoin (0) | 2023.06.21 |
| 2023-06-20 Fear & Greed Index (0) | 2023.06.20 |
| 2023-06-20 Market Value to Realized Value (MVRV) (0) | 2023.06.20 |


